| Coburg weather | |||
|---|---|---|---|
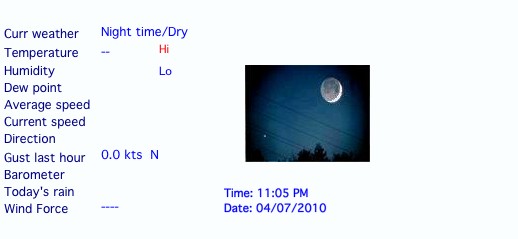
| LAST READING AT TIME: 2:00 PM DATE: 14 September 2009, time of next update: 14:05 PM | |||
| Current Weather | Dry | Current Temperature | 17.0°C (62.6°F) (Heat Index 17.0°C ), Apparent temp 16.4°C |
| Maximum Temperature (since 9am) | 18.0°C at: 1:14 PM | Minimum Temperature (since 9am) | 5.1°C at: 6:25 AM |
| Average windspeed (ten minute) | 0.4 kts (0.7 kmh) | Wind Direction (ten minute) | S (178°) |
| Windchill Temperature | 17.0°C | Maximum Gust (last hour) | 4.9 kts (9.0 kmh) at: 1:09PM |
| Maximum Gust (since 9am) | 4.9 kts (9.0 kmh) at: 12:58 AM | Maximum 1 minute average (since 9am) | 2.9 kts (5.4 kmh) at: 1:12 AM |
| Rainfall (last hour) | 0.0 mm | Rainfall (since 9am) | 0.0 mm (0.00 in.)--- |
| Rainfall This month | 20.2 mm (0.80 in.) | Rainfall To date this year | 143.2 mm (5.64 in.) |
| Maximum rain per minute (last hour) | 0.0 mm/min | Maximum rain per hour (last 6 hours) | 0.0 mm/hour |
| Yesterdays rainfall | 0.0 mm | DewPoint | 1.8°C (Wet Bulb :10.2°C ) |
| Humidity | 36 %, Humidex 15.3°C | Barometer corrected to msl | 1021.0 hPa |
| Pressure change | 0.0 hPa (last hour) | Trend (last hour) | STEADY |
| Pressure change (last 12 hours) | +0.0 hPa | Pressure change (last 6 hours) | -1.0 hPa |
| Current Indoor temp. 17.4°C | |||
| Current Indoor hum. 36% | |||
Use the RELOAD facility on your browser to retrieve the latest data.
2:00 PM .....................current time
14/09/09 .....................current date
6:22 ..................sun rise time (make sure you have the correct lat/lon
in view/sun moon)
18:09 ...................sunset time
Day................If day time, its says Day, if night time, its says, Night (based on your sunrise/sunset)
3:05 .................moon rise time
12:46 ..................moon set time
Moon age: 24 Days 4 Hours 4 Minutes
,27.20...................current age of the moon (days since new moon)
27.20%.................Moon phase�%
11:44 20/03/2009 ..............March equinox date
05:44 21/06/2009 ..............June solstice date
21:22 11/09/2009 ................September equinox date
17:48 21/12/2009 ...............December solstice date
val_perihel...............Next Moon perihel date
val_aphel.................Next moon perihel date
04:54 19/08/2009 ...............Next moon perigee date
11:04 31/08/2009 ................Next moon apogee date
20/08/2009...................Date/time of the next/last new moon
18/09/2009...............Date/time of the next new moon for next month
28/08/2009..............Date/time of the next/last first quarter moon
10/09/2009...............Date/time of the next/last last quarter moon
04/09/2009..................Date/time of the next/last full moon
Solar Annular eclipse Southern emisphere radius 164.68 Km 26:01 UTC 2009/08/0 Solar Total eclipse Northern emisphere radius 99.91 Km 22:07 UTC 2009/02/36
................Next sun eclipse
Lunar penumbral eclipse Southern emisphere 09:02 UTC 2009/14/39 Lunar penumbral eclipse Southern emisphere 07:07 UTC 2009/09/39 Lunar penumbral eclipse Northern emisphere 06:08 UTC 2009/00/40 ...............Next moon eclipse date
Easter date 12 April 2009................Next easter date
Dry ..............current weather conditions, based on your data
............special status message
---.........For the warning email custom email (what warning was exceeded)
10.37L.................Weather Display version number you are running
.........The text you enter for current weather conditions
DATE: 14 September 2009..............Date with "January", for example, in it
....What it says - for the weather warning....
00...............Current minute
14.................Current hour
14..................Current day
09................Current month
2009.................Current year
00............UTC Current minute
04..............UTC Current hour
14...............UTC Current day
09.............UTC Current month
2009..............UTC Current year
6444...........Estimated cloud base height, feet, (based on dew point, and you height above sea level...enter this under setup)
1965.........Estimated cloud base height, metres, (based on dew point, and you height above sea level...enter this under setup)
184...........Station altitude, feet, as set in the units setup
-37:45:17...........Latitude (from the sun moon rise/set setup)
-144:56:33..........Longtitude (from the sun moon rise/set setup)
Coburg VIC...............Station name, from noaa setup, or clientraw real time ftp
Averages/Extreme
================
13.5.........Average temperature so far for the month
13.5..Average temperature so far for the month, celsius always
58.3..........Average humidity so far for the month
4.7...........Average dew point so far for the month
4.7....Average dew point so far for the month, celsius always
1000.4.........Average barometer so far for the month
1000.4.......Average barometer so far for the month, mb (hPa) always
1.8........Average windspeed so far for the month
1.8.....Average windspeed so far for the month, knots always
0.9......Average windspeed so far for the month, m/s always
3.3.....Average windspeed so far for the month, kmh always
2.7.........Average gustspeed so far for the month
2.7......Average gustspeed so far for the month, knots always
1.4.......Average gustspeed so far for the month, m/s always
5.1......Average gustspeed so far for the month, kmh always
301..........Average direction so far for the month
West northwesterly......Average direction so far for the month, in words
Northerly.Max gust direction in words.
354..Max gust direction in Degrees.
29.4........Maximum temperature so far for the month
29.4.Maximum temperature so far for the month, celsius always
4.8........Minimum temperature so far for the month
4.8.Minimum temperature so far for the month, celsius always
95.0.........Maximum humidity so far for the month
19.0.........Minimum humidity so far for the month
11.6..........Maximum dew point so far for the month
11.6...Maximum dew point so far for the month, celsius always
-0.5..........Minimum dew point so far for the month
-0.5...Minimum dew point so far for the month, celsius always
1023.0........Maximum barometer so far for the month
1023.0......Maximum barometer so far for the month, mb (hpa) always
1002.0........Minimum barometer so far for the month
1002.0......Minimum barometer so far for the month, mb (hpa) always
10.0........Maximum av speed so far for the month
5.1......Maximum av speed so far for the month, m/s always
10.0.....Maximum av speed so far for the month, knots always
18.5.....Maximum av speed so far for the month, kmh always
24.0........Maximum max gust so far for the month
12.3......Maximum max gust so far for the month, m/s aways
24.0.....Maximum max gust so far for the month, knots aways
44.4.....Maximum max gust so far for the month, kmh aways
12.5..........Average temperature last 24 hours
...Average temperature for the hour (put the hour number immediatly after this tag,and then the month and then the year numbers
e.g � for the average temperature for 8am (use a 24 hour clock) (hour preceding that, for the month of March 2003)
...Same thing, but for humidity
1018.5..........Average barometer last 24 hours
...Actual temperature for the hour (put the hour number immediatly after this tag,and then the month and then the year numbers
0...............Days where the maximum temperature did not go over 0oC (current month)
0..............Days where the maximum temperature went over 30oC
1..............Days where the maximum temperature went over 25oC
0...............Days where the minimum temperature went below 0oC
0.............Days where the minimum temperature went below -15oC
0..............Days where the maximum temperature went over 40oC
214...........Days where the maximum temperature did not go over 0oC (current month) ****year to date
0..........Days where the maximum temperature went over 30oC
1..........Days where the maximum temperature went over 25oC
0...........Days where the minimum temperature went below 0oC
0.........Days where the minimum temperature went below -15oC
0..........Days where the maximum temperature went over 40oC
62.4..................Heating degree days month to date
3.4..................Cooling degree days month to date
5.7....................Heating degree days ,today
0.0....................Cooling degree days ,today
16.0...................Cooling degree days year to date (slow)
877.4...................Heating degree days year to date (slow)
---............Difference between the current month to date rainfall and the average rainfall for the month (total for the current month)
Nan........Difference between the current year to date and the average for the year to date (includes current month as total) (from your entered averages)
Tags from the daily averages/extreme page (month to date) (note that will still need to be enabled)
=========================================
" " i.e in the same data sequence as that appears on the averages/extreme page (e.g february2003.htm)
the last 31 are the rain for the day of the month (blank if no rain that day)
0.0..The average temperature for the day you would expect from your data records for that day (updates at midnight and midday)
0.0.....Max temperature to be expected for the day from your data records (you need t 2 years of data)
0.0....The minimum of above
-60.0............The maximum temperature reached for this day, from your data records
50.0............The minimum temperature reached for this day, from your data records
2009........The year the above reading was reached
2009
0.0...............Todays average max temperature from the selected Wunderground almanac station
0.0...............Todays average min temperature from the selected Wunderground almanac station
0.0..............Todays record max temperature from the selected Wunderground almanac station
0.0..............Todays record min temperature from the selected Wunderground almanac station
0............Year that it occured
0............year that it occured
September2009.htm....The filename, of the current averages/extreme web file (e.g April2004.htm)
...................Creates the drop down list selection
29.4.........Max temp over the last week
5.1.........Min temp over the last week
1023.0.........Max baro over the last week
1004.0.........Min baro over the last week
95.0..........Max hum over the last week
19.0..........Min hum over the last week
10.0.........Max wind (average) over the last week
24.0.........Min gust over the last week
Sat.....Day of max temp over the last week
Mon.....Day of min temp over the last week
Mon.....Day of max baro over the last week
Mon.....Day of min baro over the last week
Tue......Day of max hum over the last week
Sat......Day of min hum over the last week
Sat.....Day of mMax wind (average) over the last week
Sat.....Day of min gust over the last week
14.1..........Average temp over the week
58.7...........Average hum over the week
1013.5..........Average baro over the week
1.9..........Average wind over the week
3.2..........Average gust over the week
4.4............total rain over the last 7 days (from graph data)
Temperature/Humidity
====================
Current:
--------
17.0 .....................temperature
17 .................temperature, no decimal place
2...................dew point, no decimal place
36 ......................humidity
1. ......................dew point
17.0 ....................current heat index
17 ................current heat index,no decimal place
18.0 ..................today's maximum temperature
18 ..............today's maximum temperature, no decimal place
1:14 PM .................time this occurred
5.1 ..................today's minimum temperature
5 ..............today's minimum temperature, no decimal place
6:25 AM .................time this occurred
17.0 ...................current wind-chill
17 ...............current wind-chill, no decimal place
5. ................minimum wind-chill
6:25 AM ...............time this occurred
18. .............maximum wind-chill
1:14 PM ............time this occurred
74 ..................high humidity
7:05 AM .................time this occurred
35 ...................low humidity
1:14 PM ..................time this occurred
17. ...............indoor temperature
36 ................indoor humidity
4. ...................high dew point
9:14 AM ..................time this occurred
0. ...................low dew point
12:28 AM ..................time this occurred
18. ..................high heat index
1:14 PM .................time this occurred
5. ..................low heat index
6:25 AM .................time this occurred
54.1.........Average temperature since 6am in oF
12.3............Average temperature since 6am in oC
50.7.........Average temperature since 6pm in oF
10.4............Average temperature since 6pm in oC
17.0 .............outdoor temperature always in metric (even if US units selected)
1.8 ..............dew point always in metric
17.0 ........heat index always in metric
17.0 ........wind chill always in metric
18.0 ..........maximum heat always in metric
5.1 ..........minimum heat always in metric
4.5........maximum dew point always in metric
0.3.........minimum dew point always in metric
18.0......maximum high windchill always in metric
5.1.......minimum low windchill always in metric
10.2...................Current wet bulb reading
62.6.................Temperature in oF
35.3..................Dew point temperature in oF
64.4.............Today's high temp in oF
41.2..............Today's low temp in oF
17.4........Indoor temperature always in oC
-1.0.........Dew point change last hour
-0.3..Temperature change last hour always in metric
-0.5...Temperature change last hour always in faren
17...Temperature rounded to whole number, celsius
63.....Temperature rounded to whole number, faren
-2.........Humidity change last hour
20.0.............Maximum indoor temperature
20.0......Maximum indoor temperature, celsius always
16.6.............Minimum indoor temperature
16.6......Minimum indoor temperature, celsius always
12:00 AM............Time of Maximum indoor temperature
8:34 AM............Time of Minimum indoor temperature
-10..........US Navy water temperature, celsius
14............US Navy water temperature, faren
---................US Navy visibility reading (miles)
0.0..................Current soil temperature
16.4..............Apparent temperature
16.4.........Apparent temperature in the sun (you need a solar sensor)
16.4.............Apparent temperature, �C
16.4........Apparent temperature in the sun, �C (you need a solar sensor)
61.5.............Apparent temperature, �F
61.5........Apparent temperature in the sun, �F (you need a solar sensor)
0.0................Extra temperature sensor 1 (change through to 8)
35.9............Indoor dew point (oF)
2.2..........Indoor dew point (oC)
59.6..............Humidex value in oF
15.3............Humidex value in oC
19.9........The maximum temperature in the last immediate 24 hours
5.1........The minimum temperature in the last immediate 24 hours
16:03:58 13/09/09.......Time/date of the maximum temperature in the last immediate 24 hours
06:27:25 14/09/09.......Time/date of the minimum temperature in the last immediate 24 hours
0.0................Black globe temperature from Environdata weather master 2000 station (oC)
58.9.......................Heat stress calculation (oC)
51.9.......................Heat stress load (used with Cattle), gust windspeed used (oC)
%HLIavwind%.................Heat stress load (used with Cattle), average windspeed used (oC)
137.9......................Heat stress calculation (oF)
125.3......................Heat stress load (used with Cattle), gust windspeed used (oF)
%HLIavwindf%................Heat stress load (used with Cattle), average windspeed used (oF)
39..............Maximum indoor humidity
36..............Minimum indoor humidity
8:47 AM....Time of maximum indoor humidity
12:00 AM.....Time of minimum indoor humidity
1.223................Current air density, kg/m3
48.3097....................Absolute humidity, kg/m3
0.0.........If using non standard extra temperature sensors, but will work for any station
0.0
0.0
-100.0
-100.0
-100.0
-100.0
6.8...............Difference between the wet bulb temperature and the outdoor temperature
-100.0...............Maxium daily soil temperature (either you have set a extra temperature sensor as soil or its a VP soil temperature)
-100.0...............Minimum daily soil temperature
0.0.........Soil temperature oC (no matter what units selected in WD)
17.................Shows heat index or humidex or windchill (if less than 16oC)
17.0...............same, but shows it with a decimal place
18.0.............Hi temperature since 6am (to 6pm (resets then)
5.1.............Low temperature since 6am (to 6pm (resets then)
18.2...........HI temperature since 6pm (till 6am, resets then)
5.1...........Low temperature since 6pm (till 6am, resets then)
Yesterday:
----------
-0.3............Temperature change in the last hour
11.................Yesterday's max dew point
12:17 PM...............Time of yesterday's max dew point
-0.................Yesterday's min dew point
12:57 AM...............Time of yesterday's min dew point
10:26 AM...............Time of yesterday's max humidity
21................Yesterday's min humidity
12:00 AM...............Time of yesterday's min humidity
23...............Yesterday's max windchill
12:00 AM.............Time of yesterday's max windchill
10...............Yesterday's min windchill
11:58 PM.............Time of yesterday's min windchill
25................Yesterday's max heatindex
3:42 AM..............Time of yesterday's max heatindex
10................Yesterday's min heatindex
11:58 PM..............Time of yesterday's min heatindex
23................Yesterday's max temperature
12:00 AM..............Time of yesterday's max temperature
10................Yesterday's min temperature
11:58 PM..............Time of yesterday's min temperature
24..........Yesterday's Maximum indoor temperature
20..........Yesterday's Minimum indoor temperature
12:18 AM........Time of yesterday's Maximum indoor temperature
11:55 PM........Time of yesterday's Minimum indoor temperature
Trends:
-------
-0.5 C..........Temperature change in the last 24 hours (from the trends, includes units)
+11.0 hpa..........Barometer change in the last 24 hours (from the trends, includes units)
-22 %...........Humdidity change in the last 24 hours (from the trends, includes units)
-3.0 kts..........Wind change in the last 24 hours (from the trends, includes units)
-7.5 C...........Dew change in the last 24 hours (from the trends, includes units)
0.0 mm..........Rain change in the last 24 hours (from the trends, includes units)
17.5............The temperature 24 hours ago
1010.0............The barometer 24 hour ago
---..............Maximum temperature this day 1 year ago (if you have that data)
---..............Minimum temperature this day 1 year ago (if you have that data)
Wind
====
Current:
--------
0.0 ...................average wind speed (current)
0 ...................current average wind speed, no dec. place.
0 ................current average wind speed, no dec. place., mph always
0.0 ...................current/gust wind speed
0 .................current/gust wind speed, no dec. place.
0 ..............current/gust wind speed, no dec. place., mph always
158 ...................wind direction (degrees)
SSE .................wind direction (NNE etc)
OZO.............wind direction (NNE etc), Dutch
East south east............Wind direction in words
Oost Zuid Oost.......Wind direction in words, Dutch
4.9 ...................today's maximum wind speed
5 ...............today's maximum wind speed, no dec. place
4.9 knots from the west north west............... " " " ", with words, i.e westerly (i.e for telephone)
WNW.....Max Gust direction, i.e. W
WNW.....Max Averge direction, i.e. W
12:58 AM ..................time this occurred
2.9 ................maximum average wind speed
1:12 AM ...............time this occurred
4.9 kts ESE .................maximum gust last hour
1:09PM ................time this occurred
4.9...Maximum gust for the last prior 1 hour period
1:10PM time that the max gust last prior 1 hour occured
147 Direction from Max gust last prior 1 hour period
SSE Direction from Max gust last prior 1 hour period, in words
2.7.....Maximum gust for the last immediate 10 minute period
2.9.....Maximum gust for the last 10 to 15 minutes
2.9.....Maximum gust for the last 15 to 30 minutes
4.9.....Maximum gust for the last 30 to 60 minutes
5.0....Maximum gust for the last 60 to 120 minutes
0.4......Average wind for the last immediate 10 minute period
0.5......Average wind for the last 10 to 15 minutes
0.6......Average wind for the last 15 to 30 minutes
1.1......Average wind for the last 30 to 60 minutes
0.7.....Average wind for the last 60 to 120 minutes
178.......Average dir wind for the last immediate 10 minute period
170.......Average dir wind for the 10 to 15 minutes
217.......Average dir wind for the 15 to 30 minutes
178.......Average dir wind for the 30 to 60 minutes
193......Average dir wind for the 60 to 120 minutes
178 ............average ten minute wind direction (degrees)
0.4 ..........average ten minute wind speed
1.0 .............maximum gust in the last minute
3 .........maximum 1 minute average wind speed (since the reset time)
0.0 ..........current average wind speed always in knots
0.0 ........current gust speed always in knots
0.0 .............current average wind speed always in kmh
0.0 ...........current gust speed always in kmh
0 ..............Beaufort wind force number
0 bft..............Current Beaufort wind speed
4.9....Today's maximum gust in knots
4.9...Maximum gust last hour in knots
0.4......Average 10 minute speed in knots
0.7.........Average 10 minute speed in kmh
2.9...........Maximum daily average speed in kts
5.0........Maximum gust imeediate last hour in kts
1.0.......Maximum gust last minute in kts
3.0...Maximum 1 mintue average speed in kts last 12 hours
4.9.........Maximum daily gust in kts
4.9..........Create your own windspeed dial (will replace this with avwindpoint1 for 1 kt speed, etc
4.9..........Create your own windspeed dial (will replace this with gustwindpoint1 for 1 kt speed, etc
0 bft........10 minute average speed, in bft number
0.0.................Average wind in mph always
0.0.................Gust wind in mph always
S.......Current average 10 minute wind direction label (i.e NNE)
0.0..Current average 10 minute windspeed in m/s
2.9.......Highest average 10 minute windspeed in the last 12 hours (in the units you have selected)
1.5.....Highest average 10 minute windspeed in the last 12 hours, m/s
2.9....Highest average 10 minute windspeed in the last 12 hours,knots
5.4....Highest average 10 minute windspeed in the last 12 hours,kmh
2.5.......Today's maximum gust in m/s
2.5......Maximum gust last hour in m/s
0.2.........Average 10 minute speed in m/s
1.5...........Maximum daily average speed in m/s
2.6........Maximum gust immediate last hour in m/s
0.5.......Maximum gust last minute in m/s
9.0.......Today's maximum gust in kmh
1.5...Maximum 1 mintue average speed in kts last 12 hours
2.5.........Maximum daily gust in m/s
5.6.........Maximum daily gust in mph
726.13 km....Wind run to date this month
12239.04 km.....Wind run to date this year
14.1..............Wind run today
Calm..............Beaufort scale in text (i.e Fresh Breeze)
Calm............Beaufort scale in text (i.e Fresh Breeze), based on 10 minute average
284...........Last 24 hours average direction
West northwesterly.......Last 24 hours average direction in words
267........Average direction so far for today (from midnight)
Westerly....Average direction in words for today (from midnight)
Yesterday:
----------
14.2 kts WNW...............Yesterday's max gust speed
14.2..........Yesterday's max gust speed, no direction
3:02 PM..............Time of yesterday's max gust speed
8.2 kts............Yesterday's max average speed
8.2.......Yesterday's max average speed, no direction
3:57 PM...........Time of yesterday's max average speed
Baromometer
===========
Current:
--------
1021.0 .....................barometric pressure
+0.0 ....................amount of change in the last hour
1023.0 .................high pressure
9:19 AM ................time this occurred
1019.0 ..................low pressure
12:00 AM .................time this occurred
-1.0 ....pressure change in the last 3 hours
-1.0 ....pressure change in the last 6 hours
0.0 ...pressure change in the last 12 hours
+11.0 ...pressure change in the last 24 hours
Steady ........pressure trend (i.e. "falling"), last hour
Falling ...pressure trend (i.e. "falling"), last 3 hours
1023.0 mb...........maximum pressure always in metric
1019.0 mb...........minimum pressure always in metric
30.150 inches.................Current barometer reading in inches.
30.15 inches..............Current barometer reading in inches, 2 decimal places only.
1021.0..............Current barometer reading in metric.
102.1.................Current baro in kpa
1021.0.......Current barometer always in mb (hpa is the same value);
+0.0....Pressure change last hour in mb
-1.0...Pressure change last 3 hours in mb
-1.0...Pressure change last 6 hours in mb
+0.0..Pressure change last 12 hours in mb
+11.0..Pressure change last 24 hours in mb
30.15...........Pressure in inches to decimal places only
............Forecast text from the Davis VP
6.96............Vapour pressure (kpa)
..........Words for the forecast icon
Yesterday:
----------
1019.0...............Yesterday's max barometer
9:19 PM..............Time of yesterday's max barometer
1006.0...............Yesterday's min barometer
12:00 AM..............Time of yesterday's min barometer
76................Yesterday's max humidity
Rain
====
Current:
--------
0.0 ....................today's rain
0.00 .................today's rain, in inches
20.2 ..................rain so far this month
143.2 ...................rain so far this year
0.0 ...................rain in the last hour
0.0 ......maximum rain per minute in the last hour
0.0 ...maximum rain per hour in the past 6 hours
0.0.......Total rain last 3 hours
0.0.......Total rain last 6 hours
0.0......Total rain last 24 hours
7.0 mm...Your average monthly rain you have entered (current month)
7.0...Your average monthly temperature you have entered (current month)
5............Consecutative days with no rain
6..............Days with rain for the month
13..........Days with rain for the year
0..............Current rain episode duration, minutes
0.0.............Today's rain in mm
20.2.............Monthly rain in mm
143.2............Yearly rain in mm
0.0............Rain last hour in mm
0.0...........Rain last 3 hours in mm
0.0...........Rain last 6 hours in mm
0.0.............Rain last hour in mm
0.0.....Maximum rain per minute last hour in mm
0.0..Maximum rain per hour last 6 hours in mm
-............Time that the last rain tip was recorded.
8/9/2009............Date that the last rain tip was recorded (not retrospective)
0.0...........Current rain rate, mm/min(or in/min)
0.0.........Current rain rate, mm/hr (or in./hr)
0.0...............Max rain rate,for the day, mm/min (or in./min)
0.0.............Max rain rate,for the day, mm/hr (or in.mm)
09:00 AM...........Time that occurred
4.3...........Total rain last 7 days
8.4 Max rain for hour month to date
Yesterday:
----------
0.0 mm ................yesterday�s rain
0.0.............Yesterday rain
0.0...........Yesterday rain in mm always
Over the last Week
------------------
2.0.............Rain on monday
2.3............Rain tuesday
0.0..........Rain on wedensday
0.0...........Rain on thursday
0.0.............Rain on friday
0.0...........Rain on saturday
0.0.............Rain on sunday
Fire Weather
============
87.6...................Fire weather index fine fuel moisture code
33.8.................... " " " build up index
.................... " " " initial spread index
20.8.................... " " " duff moisture code
223.4..................... " " " drought code
7.1.................... " " " fire weather index
Sunshine/Solar/ET
=================
1.0......................UV number
-1.0....................Daily high UV (for Davis VP stations)
1000.0.....................Daily low UV (for Davis VP stations)
0.0...............The current evapotranspiration rate calculated by WD every minute
4.3...........Total rain last 7 days
................Time that the daily high UV occured
.................Time that the daily low UV occured
-1.0................Yesterday's high UV
............Time of yesterday's high UV
112..................Time (minutes) to burn (normal skin) at the current UV rate, from the Davis VP with UV sensor
Record Readings
===============
33.6............All time record high temperature
1.2.............All time record low temperature
29.5............All time record high wind gust
15.2...........All time record high average speed
21.2...........All time record daily rain
0.3............All time record low windchill
5........All time record low windchill, hour
35......All time record low windchill, minute
8.........All time record low windchill, day
7.......All time record low windchill, month
2009........All time record low windchill, year
1034.0............All time record high barometer
987.0.............All time record low barometer
3........Day of record daily rain
4......Month of record daily rain
2009.......Year of record daily rain
30..........Day of record low baro
31.........Day of record high baro
6........Month of record low baro
5.......Month of record high baro
2009.........Year of record low baro
2009........Year of record high baro
8..........Day of record low temperature
2.........Day of record high temperature
7........Month of record low temperature
4.......Month of record high temperature
2009.........Year of record low temperature
2009........Year of record high temperature
26.........Day of record high wind gust
4.......Month of record high wind gust
2009........Year of record high wind gust
11.......Day of record high wind average speed
7.....Month of record high wind average speed
2009......Year of record high wind average speed
32.3.......Record high heat index
2....Record high heat index day
2....Record high heat index month
2009...Record high heat index year
4.4C on: 23 Jun 2009......Coldest night on record (6pm to 6am)
7.8C on: 10 Jun 2009........Coldest day on record (6pm to 6am)
23.3C on: 01 Apr 2009......Warmest night on record (6am to 6pm)
26.7 C on: 01 Apr 2009........Warmest day on record (6am to 6pm)
15.8.............Record high dew point
31..........Record high dew point, day
3........Record high dew point, month
2009.........Record high dew point, year
-0.7..............Record low dew point
8...........Record low dew point, day
7.........Record low dew point, month
2009..........Record low dew point, year
98.............Record high humidity
3..........Record high humdidity, day
6........Record high humidity, month
2009.........Record high humdiity, year
15..............Record low humidity
28...........Record low humdity, day
3.........Record low humdity, month
2009..........Record low humdity, year
17850.0...........Record high solar
%recordlhighsolarday%.......Record high solar, day
9......Record high solar, month
2009.......Record high solar, year
6.0..............Record high uv
%recordlhighuvday%..........Record high uv, day
9.........Record high uv, month
2009..........Record high uv, year
%recordhighsoil%............Record high soil temp
%recordlowsoil%.............Record low soil temp
%recordhighsoilday%.........Record high soil temp ,day
%recordlowsoilday%..........Record low soil temp, day
%recordhighsoilmonth%.......Record high soil temp ,month
%recordlowsoilmonth%........Record low soil temp, month
%recordhighsoilyear%........Record high soil temp ,year
%recordlowsoilyear%.........Record low soil temp, year
%recordlowgrass%............Record low grass temp
%recordlowgrassday%.........Record low grass temp, day
%recordlowgrassmonth%.......Record low grass temp, month
%recordlowgrassyear%........Record low grass temp, year
-50.0............Record high THSW
100.0.............REcord low THSW
310.8.........Record high wind run
11......Record high wind run, day
7......Record high wind run, month
2009.......Record high wind run, year
58.3.........Record high rain total for month
8......Record high rain for, month
2009.......Record high rain for, year
for current month to date:
29.4............All time record high temperature
4.8.............All time record low temperature
23.5............All time record high wind gust
10.3...........All time record high average speed
11.7...........All time record daily rain
4.2............All time record low windchill
1........All time record low windchill, hour
53......All time record low windchill, minute
5
9.......All time Record low windchill month
2009
1023.0............All time record high barometer
1002.0.............All time record low barometer
4........Day of record daily rain
9......Month of record daily rain
2009.......Year of record daily rain
7..........Day of record low baro
14.........Day of record high baro
9........Month of record low baro
9.......Month of record high baro
2009.........Year of record low baro
2009........Year of record high baro
5..........Day of record low temperature
12.........Day of record high temperature
9........Month of record low temperature
9.......Month of record high temperature
2009.........Year of record low temperature
2009........Year of record high temperature
12.........Day of record high wind gust
9.......Month of record high wind gust
2009........Year of record high wind gust
12.......Day of record high wind average speed
9.....Month of record high wind average speed
2009......Year of record high wind average speed
27.8.......Record high heat index
12....Record high heat index day
12....Record high heat index month
2009...Record high heat index year
6.4C on: 05 Sep 2009......Coldest night on record (6pm to 6am)
11.8C on: 08 Sep 2009........Coldest day on record (6am to 6pm)
23.2C on: 11 Sep 2009......Warmest night on record (6pm to 6am)
22.5C on: 11 Sep 2009........Warmest day on record (6am to 6pm)
4........Day of record daily rain
11.6.............Record high dew point
13..........Record high dew point, day
9........Record high dew point, month
2009.........Record high dew point, year
-0.5..............Record low dew point
13...........Record low dew point, day
9.........Record low dew point, month
2009..........Record low dew point, year
95.............Record high humidity
8..........Record high humdidity, day
9........Record high humidity, month
2009.........Record high humdiity, year
19..............Record low humidity
12...........Record low humdity, day
9.........Record low humdity, month
2009..........Record low humdity, year
17850.0...........Record high solar
%mrecordlhighsolarday%.......Record high solar, day
9......Record high solar, month
2009.......Record high solar, year
6.0..............Record high uv
%mrecordlhighuvday%..........Record high uv, day
9.........Record high uv, month
2009..........Record high uv, year
%mrecordhighsoil%............Record high soil temp
%mrecordlowsoil%.............Record low soil temp
%mrecordhighsoilday%.........Record high soil temp ,day
%mrecordlowsoilday%..........Record low soil temp, day
%mrecordhighsoilmonth%.......Record high soil temp ,month
%mrecordlowsoilmonth%........Record low soil temp, month
%mrecordhighsoilyear%........Record high soil temp ,year
%mrecordlowsoilyear%.........Record low soil temp, year
%mrecordlowgrass%............Record low grass temp
%mrecordlowgrassday%.........Record low grass temp, day
%mrecordlowgrassmonth%.......Record low grass temp, month
%mrecordlowgrassyear%........Record low grass temp, year
-50.0............Record high THSW
100.0.............REcord low THSW
100.0.........Record high wind run
100.0.........Record high wind run
12......Record high wind run, day
9......Record high wind run, month
2009.......Record high wind run, year
58.3.........Record high rain for month
m8......Record high rain for month, month
m2009.......Record high rain for month, year
for current year to date:
33.6............All time record high temperature
1.2.............All time record low temperature
29.5............All time record high wind gust
15.2...........All time record high average speed
21.2...........All time record daily rain
0.3............All time record low windchill
5........All time record low windchill, hour
35......All time record low windchill, minute
8
7
2009
1034.0............All time record high barometer
987.0.............All time record low barometer
3........Day of record daily rain
4......Month of record daily rain
2009.......Year of record daily rain
30..........Day of record low baro
31.........Day of record high baro
6........Month of record low baro
5.......Month of record high baro
2009.........Year of record low baro
2009........Year of record high baro
8..........Day of record low temperature
2.........Day of record high temperature
7........Month of record low temperature
4.......Month of record high temperature
2009.........Year of record low temperature
2009........Year of record high temperature
26.........Day of record high wind gust
4.......Month of record high wind gust
2009........Year of record high wind gust
11.......Day of record high wind average speed
7.....Month of record high wind average speed
2009......Year of record high wind average speed
32.3.......Record high heat index
2....Record high heat index day
2....Record high heat index month
2009...Record high heat index year
4.4C on: 23 Jun 2009......Coldest night on record (6pm to 6am)
7.8C on: 10 Jun 2009........Coldest day on record (6am to 6pm)
23.3C on: 01 Apr 2009......Warmest night on record (6pm to 6am)
26.7C on: 01 Apr 2009........Warmest day on record (6am to 6pm)
3........Day of record daily rain
7
8
15.8.............Record high dew point
31..........Record high dew point, day
3........Record high dew point, month
2009.........Record high dew point, year
-0.7..............Record low dew point
8...........Record low dew point, day
7.........Record low dew point, month
2009..........Record low dew point, year
98.............Record high humidity
3..........Record high humdidity, day
6........Record high humidity, month
2009.........Record high humdiity, year
15..............Record low humidity
28...........Record low humdity, day
3.........Record low humdity, month
2009..........Record low humdity, year
17850.0...........Record high solar
%yrecordlhighsolarday%.......Record high solar, day
9......Record high solar, month
2009.......Record high solar, year
6.0..............Record high uv
%yrecordlhighuvday%..........Record high uv, day
9.........Record high uv, month
2009..........Record high uv, year
%yrecordhighsoil%............Record high soil temp
%yrecordlowsoil%.............Record low soil temp
%yrecordhighsoilday%.........Record high soil temp ,day
%yrecordlowsoilday%..........Record low soil temp, day
%yrecordhighsoilmonth%.......Record high soil temp ,month
%yrecordlowsoilmonth%........Record low soil temp, month
%yrecordhighsoilyear%........Record high soil temp ,year
%yrecordlowsoilyear%.........Record low soil temp, year
%yrecordlowgrass%............Record low grass temp
%yrecordlowgrassday%.........Record low grass temp, day
%yrecordlowgrassmonth%.......Record low grass temp, month
%yrecordlowgrassyear%........Record low grass temp, year
-50.0............Record high THSW
100.0.............REcord low THSW
100.0.........Record high wind run
100.0.........Record high wind run
11......Record high wind run, day
7......Record high wind run, month
2009.......Record high wind run, year
58.3.........Record high rain for year
8......Record high rain for year, month
2009.......Record high rain for year, year
Dallas 1 Wire , Note: Now supports up to 10 for the tags (also labjack hi/lo temperature readings use these tags too)
==============
-20.0..........Dallas 1 wire current extra temp sensor temperature
-20.0..........Dallas 1 wire current 2nd extra temp sensor temperature
-20.0..........Dallas 1 wire current 3rd extra temp sensor temperature
-20.0..........Dallas 1 wire current 4th extra temp sensor temperature
-20.0..........Dallas 1 wire current 5th extra temp sensor temperature
-20.0..........Dallas 1 wire current 6th extra temp sensor temperature
-20.0..........Dallas 1 wire current 7th extra temp sensor temperature
-20.0..........Dallas 1 wire current 8th extra temp sensor temperature
-20.0..........Dallas 1 wire current 9th extra temp sensor temperature
-20.0..........Dallas 1 wire current 10th extra temp sensor temperature
0.0.......Dallas 1 wire low extra temp sensor temperature
0.0.......Dallas 1 wire low 2nd extra temp sensor temperature
0.0.......Dallas 1 wire low 3rd extra temp sensor temperature
100.0.......Dallas 1 wire low 4th extra temp sensor temperature
100.0.......Dallas 1 wire low 5th extra temp sensor temperature
100.0.......Dallas 1 wire low 6th extra temp sensor temperature
100.0.......Dallas 1 wire low 7th extra temp sensor temperature
100.0.......Dallas 1 wire low 8th extra temp sensor temperature
0.0.......Dallas 1 wire low 9th extra temp sensor temperature
100.0.......Dallas 1 wire low 10th extra temp sensor temperature
0.0......Dallas 1 wire high extra temp sensor temperature
0.0......Dallas 1 wire high 2nd extra temp sensor temperature
0.0......Dallas 1 wire high 3rd extra temp sensor temperature
-50.0......Dallas 1 wire high 4th extra temp sensor temperature
-50.0......Dallas 1 wire high 5th extra temp sensor temperature
-50.0......Dallas 1 wire high 6th extra temp sensor temperature
-50.0......Dallas 1 wire high 7th extra temp sensor temperature
-50.0......Dallas 1 wire high 8th extra temp sensor temperature
0.0......Dallas 1 wire high 9th extra temp sensor temperature
-50.0......Dallas 1 wire high 10th extra temp sensor temperature
12:00 AM...Dallas 1 wire low time extra temp sensor temperature
12:00 AM...Dallas 1 wire low time of 2nd extra temp sensor temperature
12:00 AM...Dallas 1 wire low time of 3rd extra temp sensor temperature
...Dallas 1 wire low time of 4th extra temp sensor temperature
...Dallas 1 wire low time of 5th extra temp sensor temperature
...Dallas 1 wire low time of 6th extra temp sensor temperature
...Dallas 1 wire low time of 7th extra temp sensor temperature
...Dallas 1 wire low time of 8th extra temp sensor temperature
12:00 AM...Dallas 1 wire low time of 9th extra temp sensor temperature
...Dallas 1 wire low time of 10th extra temp sensor temperature
12:00 AM..Dallas 1 wire high time of extra temp sensor temperature
12:00 AM..Dallas 1 wire high time of 2nd extra temp sensor temperature
12:00 AM..Dallas 1 wire high time of 3rd extra temp sensor temperature
..Dallas 1 wire high time of 4th extra temp sensor temperature
..Dallas 1 wire high time of 5th extra temp sensor temperature
..Dallas 1 wire high time of 6th extra temp sensor temperature
..Dallas 1 wire high time of 7th extra temp sensor temperature
..Dallas 1 wire high time of 8th extra temp sensor temperature
12:00 AM..Dallas 1 wire high time of 9th extra temp sensor temperature
..Dallas 1 wire high time of 10th extra temp sensor temperature
0............Dallas 1 wire current humidity
74........Dallas 1 wire humidity high
35.........Dallas 1 wire humidity low
7:05 AM....Dallas 1 wire humidity high time
1:14 PM.....Dallas 1 wire humidity low time
0...........Dallas 1 wire 2nd extra humidity
0.......Dallas 1 wire 2nd humidity high
-100........Dallas 1 wire 2nd humidity low
...Dallas 1 wire 2nd humidity high time
....Dallas 1 wire 2nd humidity low time
0...........Dallas 1 wire 3rd extra humidity
0.......Dallas 1 wire 3rd humidity high
-100........Dallas 1 wire 3rd humidity low
...Dallas 1 wire 3rd humidity high time
....Dallas 1 wire 3rd humidity low time
0...........Dallas 1 wire 4th extra humidity
0.......Dallas 1 wire 4th humidity high
-100........Dallas 1 wire 4th humidity low
...Dallas 1 wire 4th humidity high time
....Dallas 1 wire 4th humidity low time
0.0..........Volts from a dallas 1 wire solar sensor
0.0......Temperature from a Bray/Jennings or AAG barometer
0.0.............Current Dallas 1 wire humidity sensor temperature
-100.0.........Daily high " " " " " "
100.0..........Daily low " " " " " "
........Time of Daily high " " " " " "
.........Time of Daily low " " " " " "
0.0.............Current Dallas 1 wire humidity sensor temperature #2
-100.0.........Daily high " " " " " "
100.0..........Daily low " " " " " "
%highdallashumtempt2%........Time of Daily high " " " " " "
%lowdallashumtempt2%.........Time of Daily low " " " " " "
0.0.............Current Dallas 1 wire humidity sensor temperature #3
-100.0.........Daily high " " " " " "
100.0..........Daily low " " " " " "
%highdallashumtempt3%........Time of Daily high " " " " " "
%lowdallashumtempt3%.........Time of Daily low " " " " " "
0.0%.............Current Dallas 1 wire humidity sensor temperature #4
-100.0.........Daily high " " " " " "
100.0..........Daily low " " " " " "
%highdallashumtempt4%........Time of Daily high " " " " " "
%lowdallashumtempt4%.........Time of Daily low " " " " " "